
In short: with the app installed on your phone, a quick look is enough to check that your cold room's cycles are clean and regular. And if an alert comes in, you can read the exact temperature at the time of the alert, but above all what happened just before: the context of the alert. The cold room controller remains your on-site reference instrument. The app does not replace it: it shows you what the controller cannot.
Two readings: which one to believe?
You are standing in front of your cold room, and the controller reads -18.2 °C. You open the Enthalpic app on your phone: -15.6 °C.
So who is wrong? The controller or the Enthalpic sensor?
Neither. It is not a bug: the probes are accurate and calibrated. Both readings are correct. They simply do not measure the same thing at the same moment. And that is exactly why both are useful.
Both are right: they do different jobs
Your cold room controller measures continuously, at the spot where its probe sits. It informs you, but above all it runs the refrigeration unit. It is your on-site reference instrument: it tells you where things stand, right now.
Our sensor does not try to give you the live temperature. It records, and builds up the history of your cold room. It measures the temperature every 15 minutes and sends its readings to the server every 3 hours. The value you see in the app is therefore the last reading sent: it may be a few minutes old, or almost 3 hours old. The exception: when a threshold is exceeded, or when the temperature returns to normal. In both cases, the readings are sent immediately and you receive a text message. Only at that moment do the two values come together.
Why not send everything continuously? Because every radio transmission uses battery power. Sending every 3 hours is what allows the sensor to run for several years without changing the battery, with no wires and without touching your installation.
Looking at the temperature on the controller at a given moment does not tell you whether everything is fine. A correct value at 10 am says nothing about what happened at 3 am, or about what is coming. That instant snapshot can hide an incident or an upcoming breakdown.
What temperature curves show
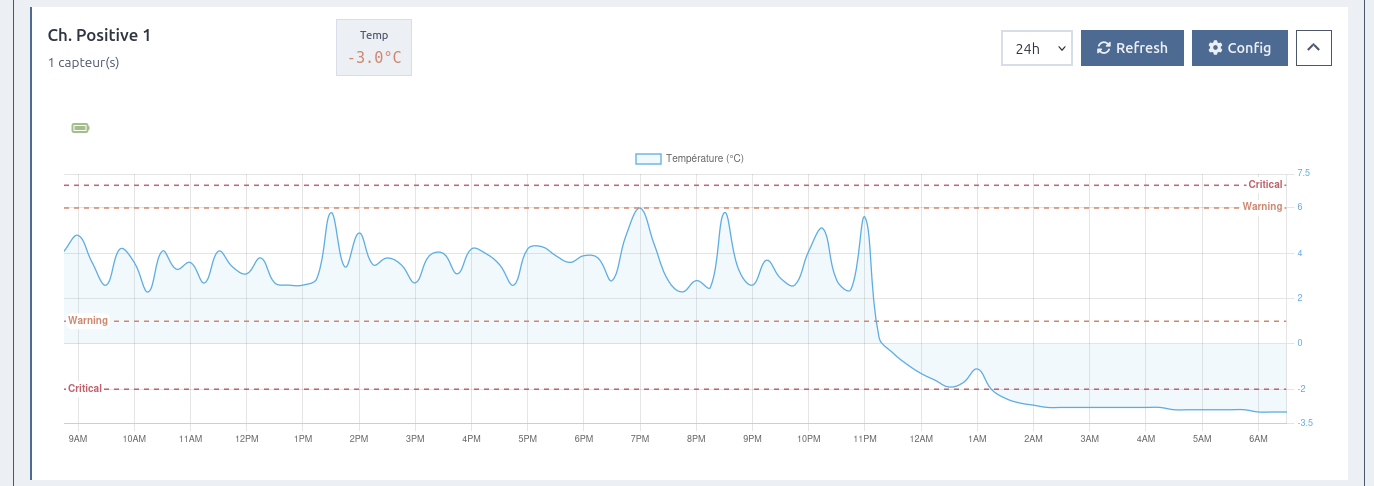
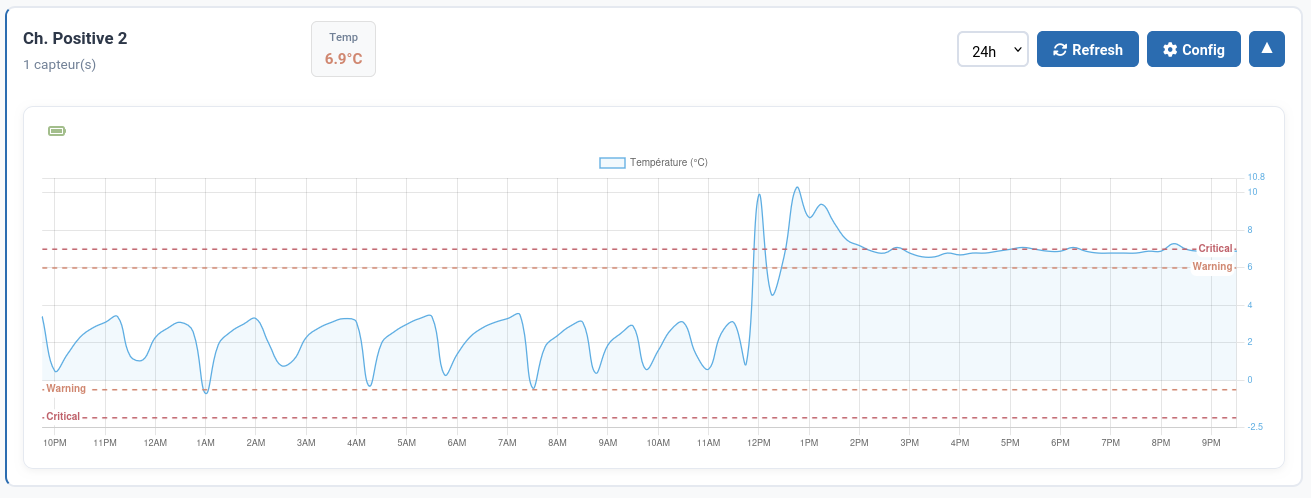
A healthy cold room draws a regular wave: the compressor starts, the temperature falls, it stops, the temperature rises gently, and so on, day after day.
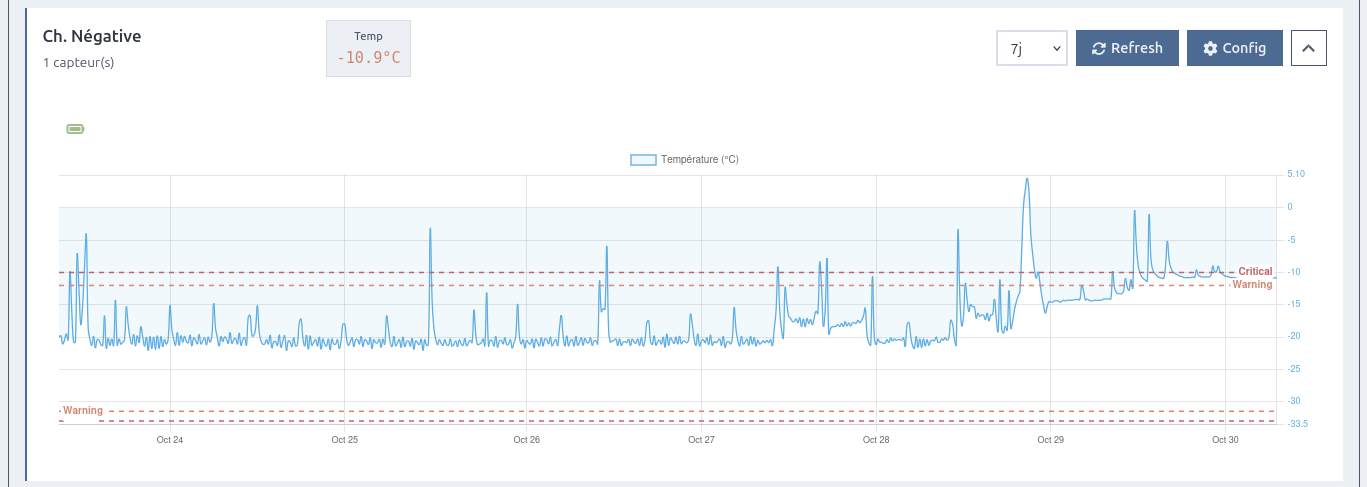
It is this regularity that you need to check from time to time. A temperature drift or an irregular cycle shows up on the curve well before the goods are at risk.
| What you see on the curve | What it most often means |
|---|---|
| Regular cycles, always between the same values | The unit is working normally. |
| A short peak, at the same times every day | A scheduled defrost. That is normal. |
| The low point of the cycles rises slowly, day after day | The unit is straining and can no longer keep up: low refrigerant, dirty condenser, worn compressor. Plan a service visit. |
| Repeated rises during the day | A door not closed properly, a damaged seal or too many openings. |
| Very erratic readings from one point to the next | A door left wide open, an evaporator fan stopped or blocked. |
| No more cycles: a flat curve, above the setpoint | The compressor runs non-stop without reaching its setpoint. The unit is at its limit. |
| No more cycles, and a temperature lower than usual | The unit no longer stops, for example because of a stuck contactor: the room becomes too cold. |
In practice
Install the app on your phone. It is the most useful step, and it only takes a few minutes.
Glance at the curves now and then. Once a day or a few times a week, a few seconds are enough to check that the cycles are clean and regular. You do not need to be a technician: you are simply looking for what has changed compared with the previous days.
When an alert comes in, open the app. When a threshold is exceeded, the sensor sends its reading immediately: the temperature shown is then the one at the time of the alert. And the curve gives you the context. A sudden rise after a delivery suggests a door left open. A drift that has lasted since the day before points to the unit. You know straight away whether to go and close a door or call a technician.
Call your technician with data. Give them a figure: "For three days, the low point of the cycles has been rising by 0.3 °C a day". Or send them a screenshot of the curve.
In summary
The controller tells you "the temperature right now". The app tells you "the unit is working properly and running within its temperature range", or warns you of the opposite. These are two complementary instruments. And because our sensors go through neither the controller nor your network, they keep alerting even if the controller is compromised, as in the recent cyberattacks on supermarkets.
A question about your curves, or a cold room without monitoring? Let's talk.
Note: two other factors can explain minor temperature differences. Location: the two probes are not in the same place, and the temperature is not the same everywhere in a cold room. Defrosting: several times a day, the air warms up by a few degrees for a few minutes. If a reading falls at that moment, the difference is larger. That is normal.